
I am DevOps Engineer working on US based construction management company’s application. After I proposed the cost and work benefits of using AWS services to the product owner, most of our workloads are AWS-based servers and RDS database instances.
My team lead asked me I could setup a system to send custom alerts to telegram channel so that all of our dev team would get notified whenever EC2 instance exceeded a specific threshold. Of course, I can I said as I had hands on experience on this. Also, I wanted these notifications to be user friendly and provide detailed information like instance ID, current CPU percentage and time of alert.
Our Requirements:
- Trigger an alert when CPU usage exceeds 80%.
- Send the alert to a specified Telegram channel.
- Customize the alert message to display clear, user-readable information.
To achieve these requirements, I utilized Amazon CloudWatch to monitor the EC2 instance’s CPU utilization, AWS Lambda for processing and sending custom alerts, and the Telegram Bot API for sending notifications to a Telegram group.
Step 1: Setting Up CloudWatch Alarm for CPU Utilization
The first step was to set up a CloudWatch Alarm that would trigger when the CPU utilization of the EC2 instance exceeded 80%.
Metric: I used the CPUUtilization.
Threshold: Set the threshold to 80%.
Alarm Actions: I set up an alarm action to trigger an AWS Lambda function whenever the CPU usage crossed the threshold.
Here’s the configuration for the CloudWatch alarm:
| Metric | Condition | Threshold |
| CPUUtilization | Greater than 80% for 5 minutes | 80% |
Step 2: Creating the AWS Lambda Function
The Lambda function was responsible for sending custom alerts to the Telegram channel. Here’s how I set it up:
Trigger: The Lambda function is triggered by the CloudWatch alarm.
Telegram API: I used the Telegram Bot API to send messages. I created a bot on Telegram and obtained the bot token and chat ID of the Telegram group where I wanted to send alerts.
Here’s the Python code I used for the Lambda function:
import json
import requests
import os

TELEGRAM_TOKEN = os.environ['TELEGRAM_TOKEN']
CHAT_ID = os.environ['CHAT_ID']
def lambda_handler(event, context):
     alarm_name = event['detail']['alarmName']
    instance_id = event['detail']['dimensions'][0]['value']
    state = event['detail']['state']['value']
    metric_value = event['detail']['state']['reasonData']['trigger']['statistic']

    message = f"Alert: EC2 Instance {instance_id} has high CPU usage!\n"
    message += f"Alarm: {alarm_name}\n"
    message += f"Current CPU Usage: {metric_value}%\n"
    message += f"Time: {event['time']}"

    url = f"https://api.telegram.org/bot{TELEGRAM_TOKEN}/sendMessage"
    data = {
        'chat_id': CHAT_ID,
        'text': message
    }

    response = requests.post(url, data=data)
    return {
        'statusCode': 200,
        'body': json.dumps('Notification sent!')
    }
Environment Variables: I stored the Telegram bot token and chat ID as environment variables to keep them secure.
| Parameter | Value |
| TELEGRAM_TOKEN | Bot Token from Telegram |
| CHAT_ID | ID of the Telegram group |
Step 3: Customizing the Alert Notification
To make the notifications more user-friendly, I customized the message sent by the Lambda function. The notification includes the following details:
- Instance ID: So users know which EC2 instance is facing high CPU usage.
- CPU Usage Percentage: The exact CPU percentage at the time of the alert.
- Time of Alert: The timestamp when the CPU exceeded the threshold.
Screenshot of the Telegram message while I was testing:
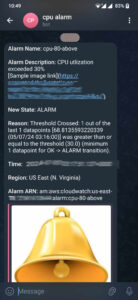
This message is easy to understand and helps our developer team take immediate action.
Step 4: Deploying the Lambda Function and Testing
- Deploy Lambda: I deployed the Lambda function and linked it with the CloudWatch alarm.
- Test: I tested the setup by generating high CPU usage on the EC2 instance and verifying that the alert was sent to the Telegram channel.
Step 5: Monitoring and Optimizing
After deployment, I set up AWS CloudWatch Logs to monitor the execution of the Lambda function. This allowed me to ensure that the notifications were being sent correctly and to debug any issues.
I also added more logic to the Lambda function to handle retries in case of network failures when sending messages to Telegram.
This solution provided real-time, user-readable alerts whenever the CPU utilization exceeded the defined threshold. By sending these alerts to a Telegram group, the team could respond quickly to high CPU usage events.
| Metric | Before Implementation | After Implementation |
| Time to Alert | 15 minutes (manual) | Immediate (real-time) |
| Notification Detail | Minimal | Detailed, Custom |
| CPU Usage Monitoring | Manual | Automated |
By combining AWS CloudWatch, Lambda, and the Telegram Bot API, I was able to create a robust, real-time monitoring system for EC2 instances. The custom Telegram alerts allowed for faster response times to CPU-related issues, improving overall infrastructure stability.
Leave a Reply